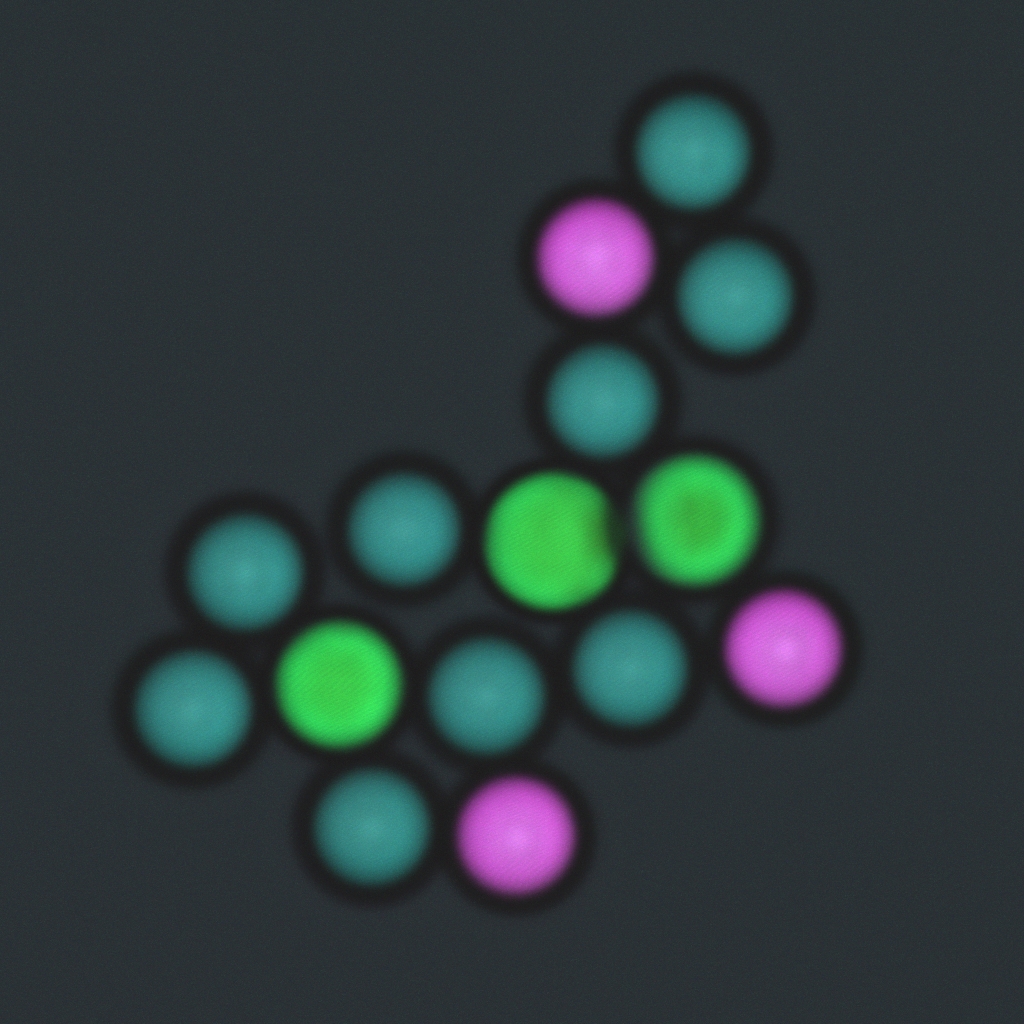
In coherent Raman microscopy or microspectroscopy, images are recorded pixel-by-pixel in 5-dimensions: X (µm), Y (µm), Z (µm), Time (s), and Raman shift (cm-1). The XYZT-dimension are relatively simple to visualise, but for the infrared region, human perception has no native colour it could associate with the Raman shift, or the complete spectra. Therefore, the data necessitates advanced visualisation techniques, such as pseudocolouring by single Raman shift, or component classification and colouring via multivariate analysis of broadband spectral data.
One intuitive and fast approach that requires no prior knowledge of the spectra is to map the visible colours to the recorded infrared region [1]. In the example below, we have recorded the stimulated Raman spectra (SRS) of mixture of three different polymer beads (melamine resin, polystyrene, and polymethyl methacrylate (PMMA), all with 8 µm nominal diameter) with our qCSI coherent Raman microscope. Each spectral point is assigned a hue, saturation, and a value according to HSV colour mapping. The HSV colour model is then converted to the RGB model and the maximum intensity projection is calculated over each colour channel to produce a 2D image where the otherwise indistinguishable white polymer bead types are clearly distinctive. The principle can be extended to the analysis of any number of particle mixtures and other heterogenous mixtures

[1] Garbacik, E.T., Herek, J.L., Otto, C. and Offerhaus, H.L. (2012), Rapid identification of heterogeneous mixture components with hyperspectral coherent anti-Stokes Raman scattering imaging. J. Raman Spectrosc., 43: 651-655. https://doi.org/10.1002/jrs.4064


One Response
Comments are closed.